Agent Observability: Logging Enough to Explain What It Did
When an agent does something odd, you need to answer why a week later. That takes a trace of every step, not a log line that says the task finished.
Sooner or later an agent does something nobody expected. It sends the wrong reply, skips a step, or takes forty actions on a task that should have needed five. The first question is always the same: why did it do that?
With ordinary software you can usually reproduce the problem and step through it. With an agent you often cannot, because the model’s choices vary from run to run and the situation that produced the odd behaviour is gone. The only way to answer the question is to have recorded enough at the time.
Why standard logging is not enough
A typical application log records events: a request arrived, a record was saved, an error occurred. That tells you what the system did. It does not tell you why, because the interesting decisions in an agent happen inside the model.
An agent run is a sequence of decisions, each made from a particular context. To understand a run you need to see what the agent saw at each step, what it chose, what the tool returned, and what it did next. A single line saying the task completed, or even failed, says almost nothing.
Record the whole trace
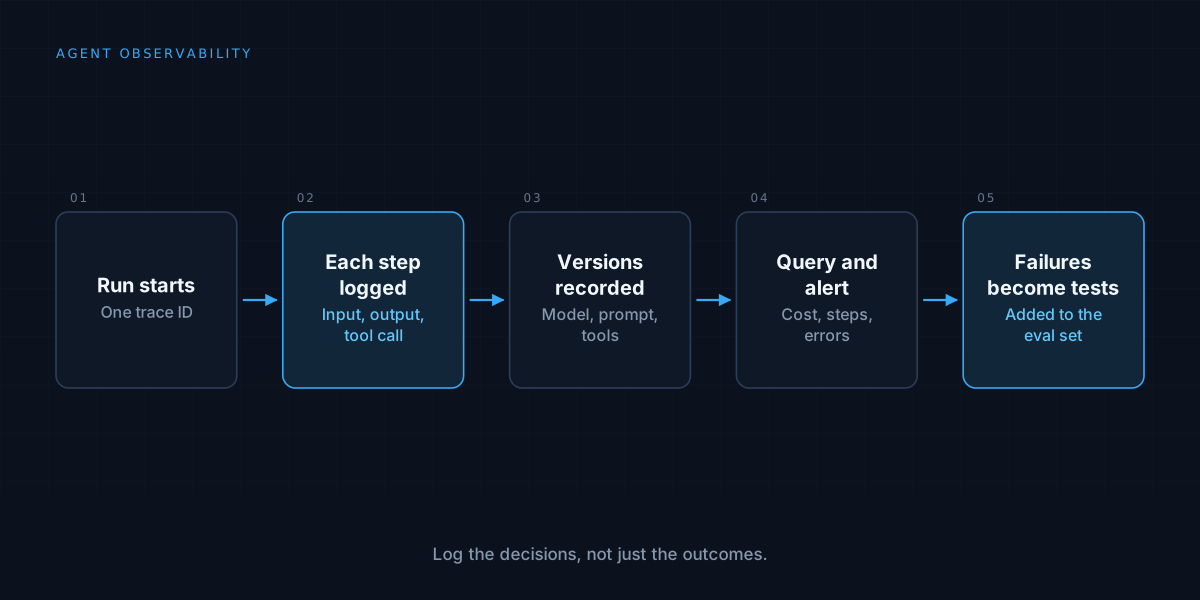
The unit to capture is the trace: one complete run from the initial goal to the final outcome, broken into steps.
For each step, record the input the model received, including the instructions and the relevant context, the model’s output, any tool call it requested with its arguments, the tool’s result, and how long and how costly the step was. Tie the steps together with a single identifier so a run can be pulled up as one story.
It feels heavy until the first time something goes wrong, and then it is the only thing that helps. A trace turns “the agent did something strange” into a sequence you can read, where the wrong turn is usually visible.
Capture versions, not just events
A trace is only reproducible if you know what produced it. Record the model and its version, the prompt version, the tool definitions, and any configuration that affected behaviour.
Without that, a change in behaviour is hard to attribute. Did the agent get worse because of a prompt edit, a model update, or a new tool? When every trace carries its own versions, the comparison between before and after becomes straightforward.
Make it searchable and aggregable
Individual traces help with individual problems. Patterns need the data to be queryable. Tag each run with the task type, outcome, cost, number of steps, and whether any step failed or was retried.
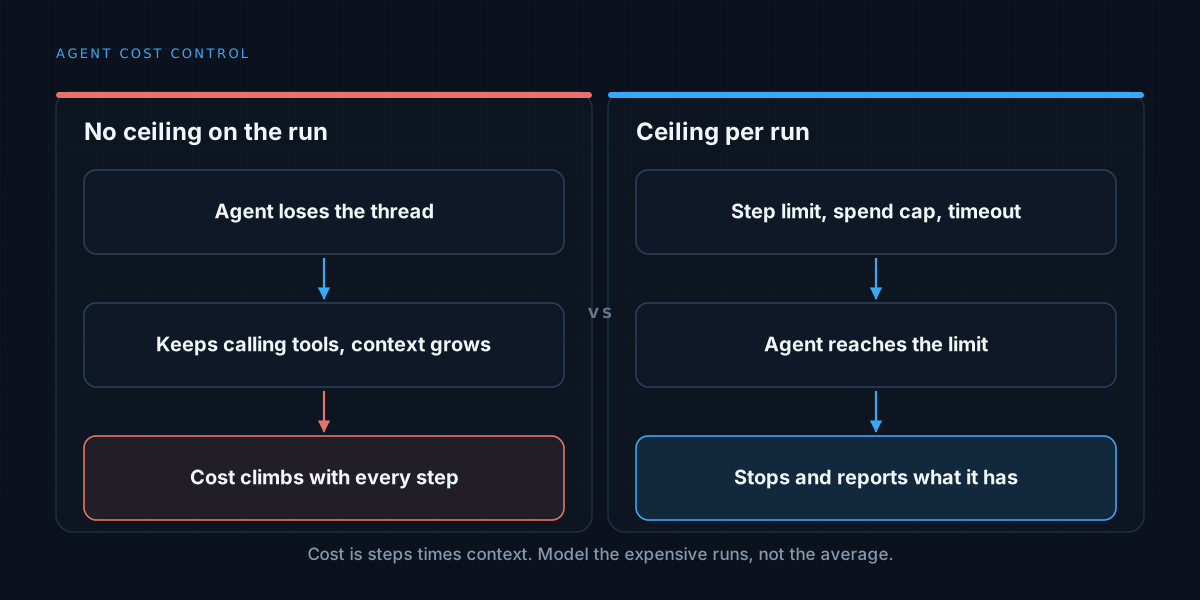
That makes questions answerable: which task types fail most, which tools error most often, which runs hit their step limit, how cost per task is trending. It also feeds the cost discipline in AI agent cost control, because you cannot control spend you cannot attribute to runs.
Watch the signals that precede failure
Some patterns show up before anything visibly breaks. A rising average step count, more tool errors, more runs ending at their limit, and growing latency are early warnings. Alerting on these catches drift while it is still cheap to fix.
This is the same discipline as building a monitoring agent applied to your own agents: decide which changes are worth attention, and route them accordingly. An alert for every anomaly teaches people to ignore the channel.
Use traces to improve, not just to debug
The traces you collect are also a source of test cases. When a run goes wrong, save that input and the expected correct behaviour into your evaluation set. Over time the set fills with real failures, which are more valuable than invented ones. The method in how to evaluate an AI agent before you trust it depends on exactly this kind of material.
Traces also reveal where people override or correct the agent. Where a human approves with edits, or rejects, that is a labelled example of the agent being wrong, and the approval queue described in human-in-the-loop AI agents is a natural place to capture it.
Mind privacy and retention
A full trace can contain customer data, internal documents, and anything else the agent touched. Decide deliberately what is stored, who can read it, and how long it is kept. Redact sensitive fields where you can, restrict access, and set a retention period. Observability that creates a data-protection problem is not an improvement.
When to keep it light
A low-stakes internal agent that runs occasionally does not need a full observability stack. Even then, keep a minimal trace: the steps, the tool calls, and the outcome, stored somewhere you can search. The investment grows with the stakes and the volume, but the habit of recording decisions should start on day one.
We build agents you can inspect, not black boxes. See how we approach agent work, or read about why agents fail in production.